Explore Dashboards of Western Hemispheric challenges
Our dashboards allow researchers, security professionals, or policy leaders to explore complex data in a format that is approachable, dynamic, and customizable.
In collaboration with our partners, they serve to amplify awareness on various security issues.
Sort by Published Date
Filter by Topic
Caribbean Illegal, Unreported and Unregulated (IUU) Fishing Dashboard
The Caribbean Illegal, Unreported and Unregulated (IUU) Fishing Dashboard provides maritime domain awareness with respect to (IUU) fishing in only the Caribbean region. Through data provided by WINDWWARD, it identifies incidents of dark activity and likely transshipments along with fishing activity located in key areas such as Marine Protected Areas (MPAs).

LAC Illegal, Unreported and Unregulated (IUU) Fishing Dashboard
The LAC Illegal, Unreported and Unregulated (IUU) Fishing Dashboard provides maritime domain awareness in respect to (IUU) fishing in the Latin America and Caribbean region. Through data provided by WINDWWARD, it identifies incidents of dark activity and likely transshipments along with fishing activity located in key areas such as Marine Protected Areas (MPAs).

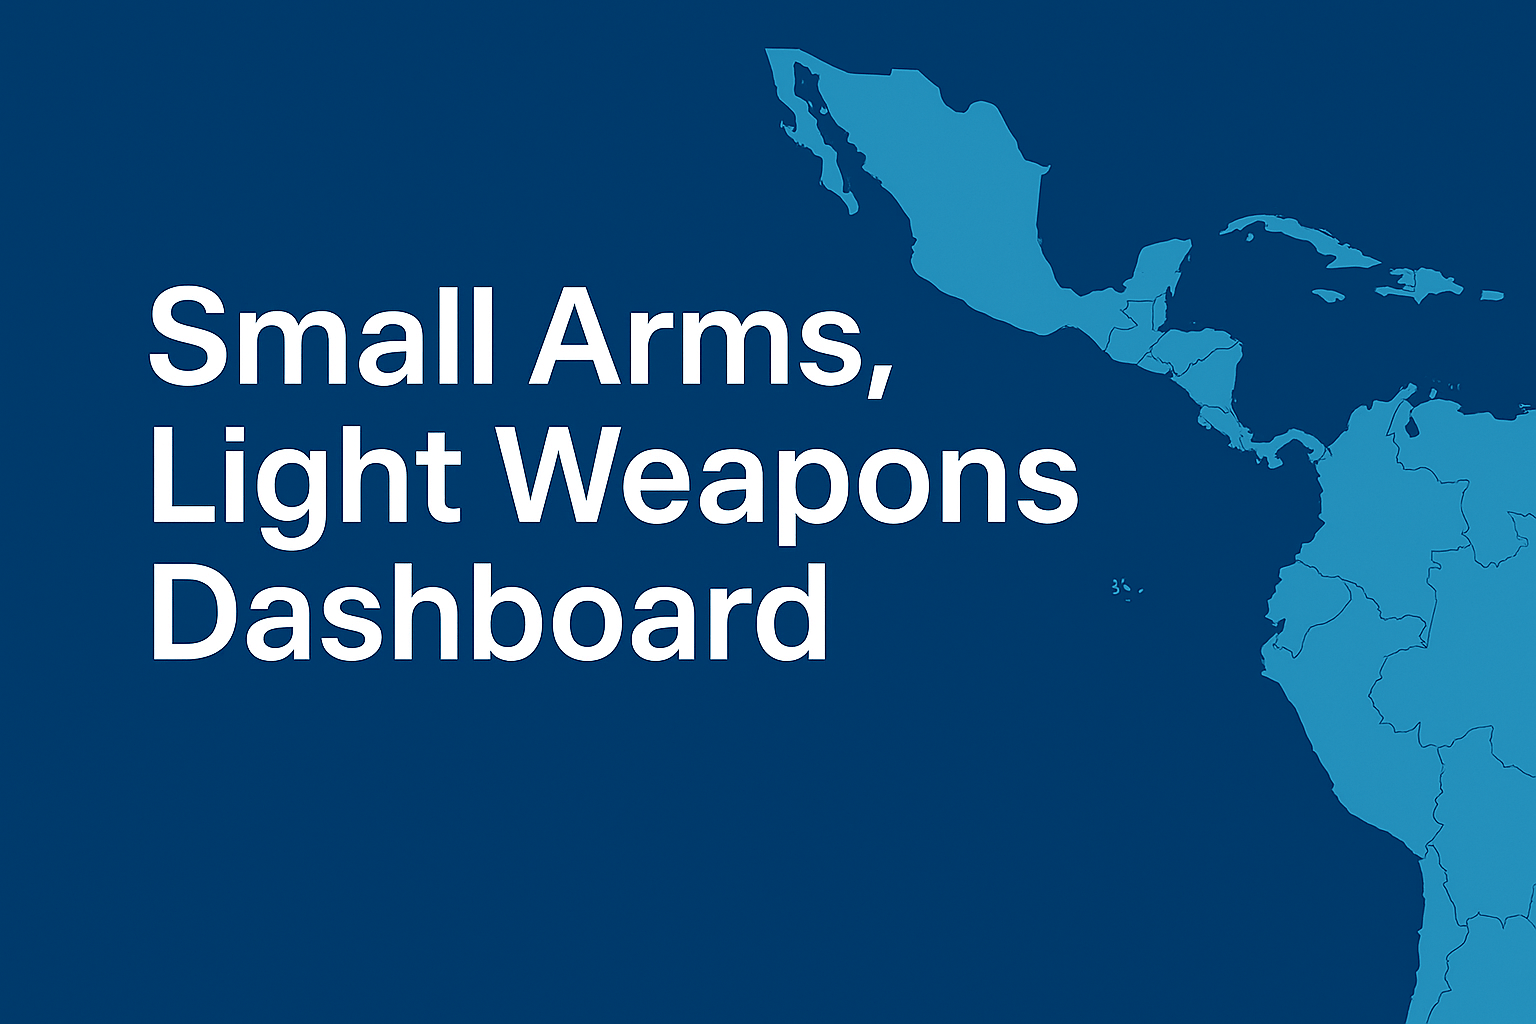
Small Arms, Light Weapons Dashboard
The Small Arms, Light Weapons (SALW) Dashboard is an ArcGIS dashboard that synthesizes data on arms seizures, thefts, and usages across Latin America. The dashboard was made in collaboration with the Regional Coordinator for Economic and Social Research (CRIES) and FIU’s GIS Center.
China’s Activities in Latin America Dashboard
The China’s Activities in Latin America Dashboard is an ArcGIS dashboard that synthesizes and visualizes data of China’s influence across Latin America. Comprehensive in its approach, it includes 12 pages encompassing key activities such as energy development projects, space-enabling facilities and, Confucious Institutes. It combines data from AEI, Boston University, The Dialogue, William & Mary’s AidData, the Australian Policy Institute, and The China Signal.

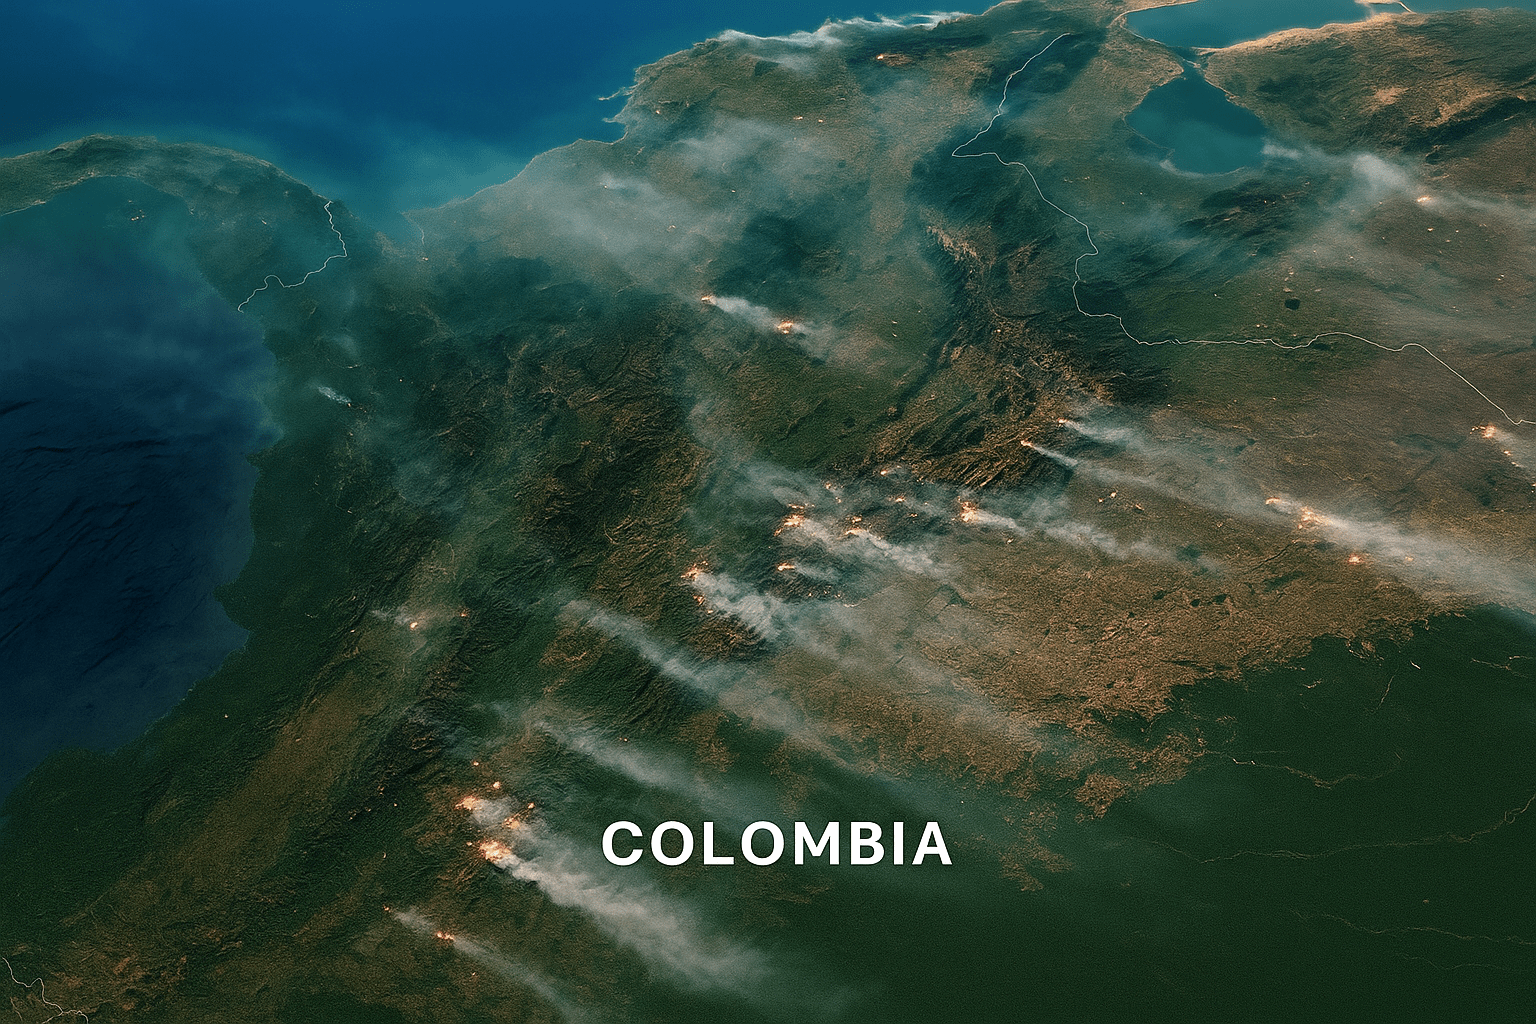
Colombia Wildfires Dashboard
This dashboard visualizes open-source and publicly available layers relevant to tracking and understanding wildfire-related events in Colombia. The dashboard pulls from several live satellite feeds, including MODIS and VIIRS satellite layers.
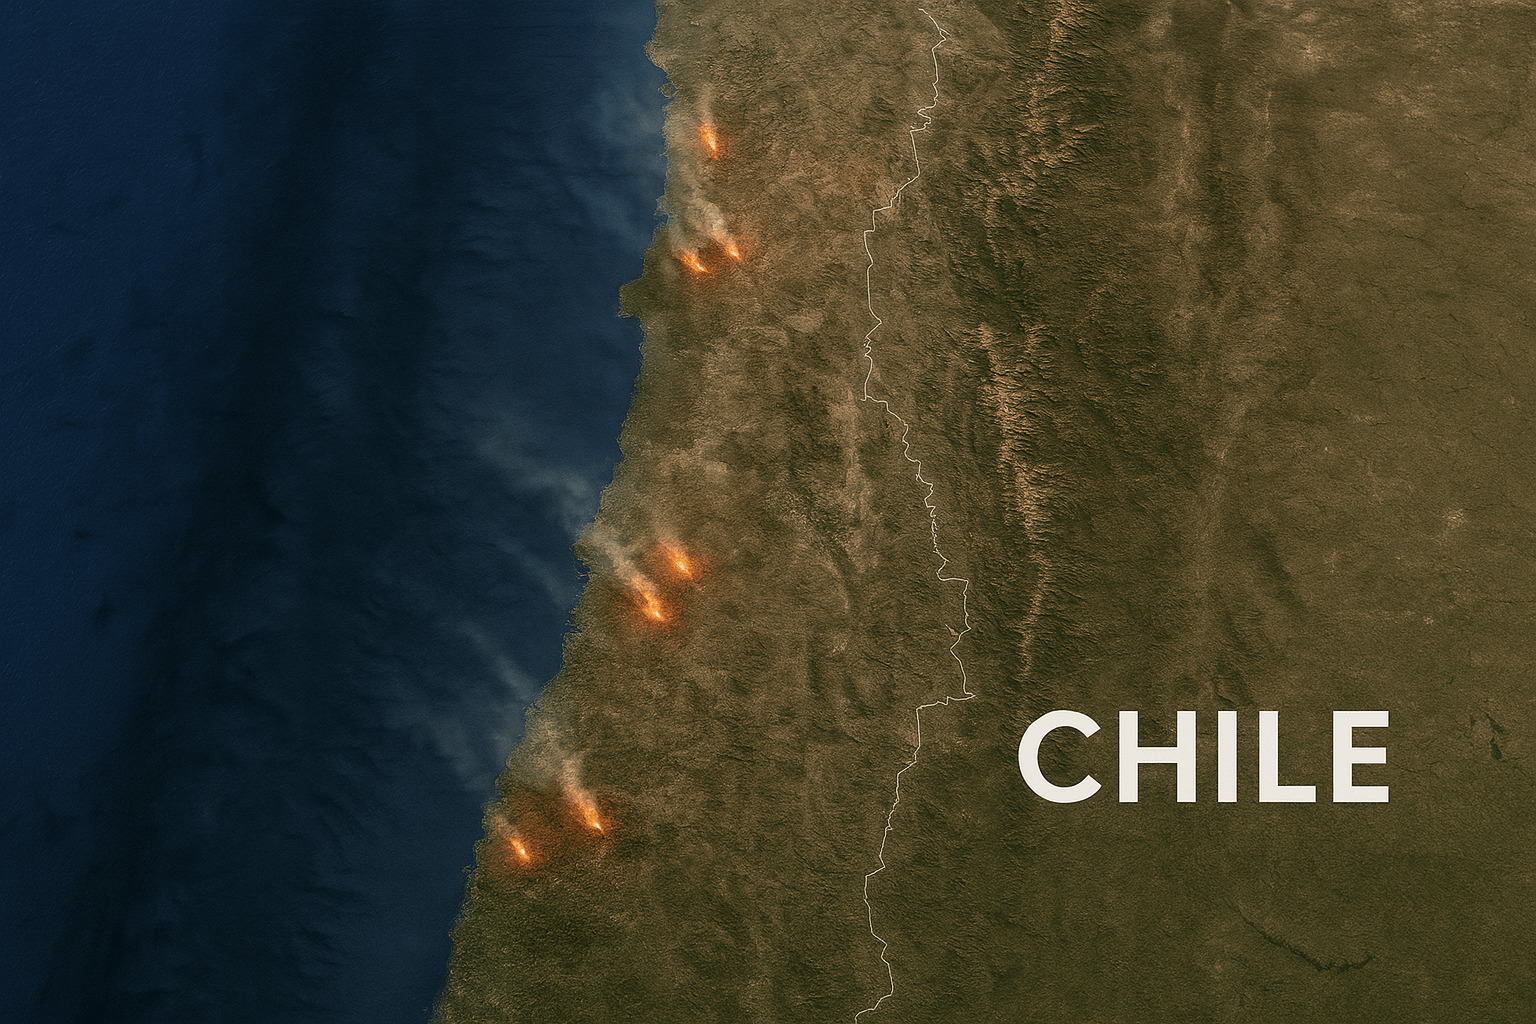
Chile Wildfires Dashboard
This dashboard visualizes open-source and publicly available layers relevant to tracking and understanding wildfire-related events in Chile. The dashboard pulls from several live satellite feeds, including MODIS and VIIRS satellite layers.